Multiple Choice
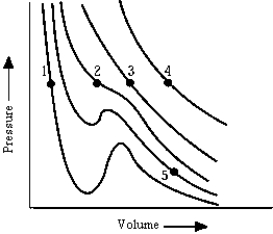 The graph shows isotherms of a gas plotted from van der Waal's equation. At which point is a mixture of liquid and vapor likely to be found?
A) 1
B) 2
C) 3
D) 4
E) 5
Correct Answer:

Verified
Correct Answer:
Verified
Related Questions
Q2: The coefficient of linear expansion for
Q7: An object at temperature 227<sup> <span
Q10: A sheet of metal has a star
Q15: The axes on a phase diagram are<br>A)temperature
Q17: If the absolute temperature of an object
Q26: You are testing thermal conduction through two
Q28: Under some conditions,real gases depart from Boyle's
Q32: The triple point of a substance gas
Q34: The gas tank of your car
Q49: Two types of wall separate a refrigerated