Multiple Choice
Exhibit 2-2 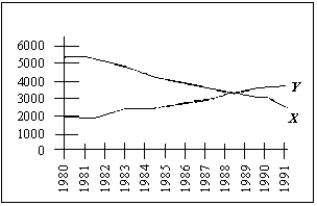
-Exhibit 2-2 shows the relationship between X and Y between 1980 and 1991.Suppose this correlation between X and Y continues to hold for the next 10 years.If Y declines over the period 1993 through 1998,we would expect
A) X to fall over the same period because X and Y are negatively correlated.
B) X to increase over the same period because X and Y are positively correlated.
C) X to increase over the same period because X and Y are negatively correlated.
D) the correlation to be unknown because we do not know the units of measurement for X and Y and thus cannot say anything about how X and Y are related.
E) X to fall over the same period because X and Y are positively correlated.
Correct Answer:

Verified
Correct Answer:
Verified
Q2: Economic models need to resemble, as much
Q16: Two variables are negatively correlated if<br>A)the value
Q32: Considering the role government plays, what term
Q40: Interpret the following data on the relative
Q44: To determine causality in many sciences,researchers<br>A)check for
Q58: Explain why economics requires historical and philosophical
Q63: There is total agreement in economics among
Q120: If two variables are correlated, then it
Q139: A system in which the government essentially
Q142: An economic model is the same as