Essay
The figure below shows the relationship of the quantity demanded for coffee beans to the price of coffee beans at a local coffee shop. 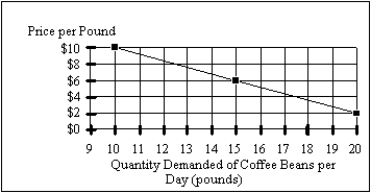 (A)If the price of coffee increases from $6 per pound to $10 per pound,by how much will the quantity demanded for coffee change?
(B)Explain how your answer in part (A)relies on the ceteris paribus assumption.
Correct Answer:

Verified
(A) The daily demand for coffee will dec...View Answer
Unlock this answer now
Get Access to more Verified Answers free of charge
Correct Answer:
Verified
View Answer
Unlock this answer now
Get Access to more Verified Answers free of charge
Q3: When economists do disagree,the disagreement usually pertains
Q4: "Inflation is currently 4 percent in the
Q5: Which of the following is a normative
Q7: In order to determine a causation between
Q19: Macroeconomics deals with large industries such as
Q93: Economic data always give an accurate picture
Q103: Economists develop new models only when new
Q107: An economic model is a tool used
Q109: A positive statement is necessarily a subjective
Q113: To argue that economics is a partisan