Essay
The table below shows the total costs of producing cherries on a small plot of land. 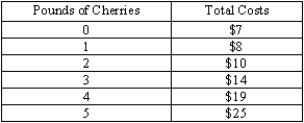
(A)Calculate the marginal cost schedule.
(B)Draw the farmer's supply curve.
(C)Suppose the price of one pound of cherries is $2.How much would this farmer produce? Show graphically the area of producer surplus.What are profits?
(D)Suppose the price of cherries goes up to $6 per pound.How much will the farmer produce now? What are profits now?
Correct Answer:

Verified
(A) 
(B)
(C)
At $2 per pound,the farm...View Answer
Unlock this answer now
Get Access to more Verified Answers free of charge
Correct Answer:
Verified
(B)
(C)
At $2 per pound,the farm...
View Answer
Unlock this answer now
Get Access to more Verified Answers free of charge
Q58: Profit maximization in a competitive market implies
Q72: A competitive firm's supply curve is<br>A)output price.<br>B)its
Q79: When more producers enter a competitive market,
Q82: A cost curve shows the amount of
Q83: Marginal cost begins to increase when<br>A)total cost
Q114: Exhibit 6-6 <img src="https://d2lvgg3v3hfg70.cloudfront.net/TB6906/.jpg" alt="Exhibit 6-6
Q123: When the production function gets flatter as
Q125: If only one firm exists in a
Q137: Most firms in the United States are
Q171: Suppose a price-taking firm has the following