Essay
The figure below shows the effect of a 2001 increase in government purchases on the hypothetical path of real GDP compared to the path of potential GDP (the baseline)between 2001 and 2005. 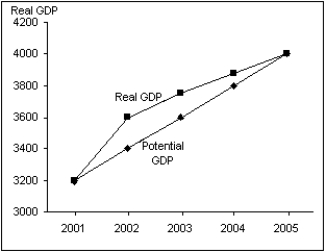 (A)Using the AD curve and IA line analysis,explain what is occurring between 2001 and 2002.
(B)Using the AD curve and IA line analysis,explain what is occurring between 2002 and 2004.
(C)Using the AD curve and IA line analysis,explain what is occurring between 2004 and 2005.
Correct Answer:

Verified
(A) As a result of the increase in gover...View Answer
Unlock this answer now
Get Access to more Verified Answers free of charge
Correct Answer:
Verified
View Answer
Unlock this answer now
Get Access to more Verified Answers free of charge
Q4: If the price of salt quadruples, will
Q19: Which of the following would lead to
Q26: Since there is no single explanation for
Q32: Suppose real and potential GDP are initially
Q53: All of the following are likely reasons
Q57: Real business cycle theories emphasize price shocks.
Q67: If the Fed is worried about inflation
Q73: If government purchases decrease, in the short
Q102: Draw an aggregate demand inflation adjustment diagram
Q145: When Paul Volcker first started to head