Essay
Exhibit 25-3 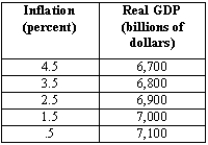
-PART I Use the data from Exhibit 25-3 to graph the aggregate demand curve:
(A)Suppose the current inflation rate is 3.5 percent and potential GDP is $6,900 billion.Draw the inflation adjustment line.What is the current deviation of real GDP from potential?
(B)In the long run,what will the inflation rate be if there is no change in economic policy? Explain how this adjustment will take place.
PART II
Suppose that after the long-run adjustment back to potential,the Fed changes its policy rule so the inflation target is 3.5 percent and potential GDP remains at $6,900 billion.Use the data to show the shift in the aggregate demand/inflation curve.
(A)What type of monetary policy is the Fed undertaking?
(B)How does the Fed accomplish this goal? What is the response of investment and net exports?
(C)In the short run,what is the deviation from potential GDP?
(D)How will the inflation adjustment line adjust in the medium and long run? Explain how this occurs.
Correct Answer:

Verified

(A)The gap between real and potential G...View Answer
Unlock this answer now
Get Access to more Verified Answers free of charge
Correct Answer:
Verified
(A)The gap between real and potential G...
View Answer
Unlock this answer now
Get Access to more Verified Answers free of charge
Q31: The long-run effect of a decrease in
Q59: Which of the following best depicts the
Q60: The short run is usually<br>A)less than half
Q61: According to the spending allocation model, what
Q66: When government purchases decrease, the short-run effect
Q103: If there is a sharp increase in
Q141: In the short run, when government purchases
Q156: Discuss why the Fed may in some
Q172: Exhibit 25-2 <img src="https://d2lvgg3v3hfg70.cloudfront.net/TB6906/.jpg" alt="Exhibit 25-2
Q173: Suppose exports increase.According to the shares of