Multiple Choice
The following graph of time-series data suggests a _______________ trend. 
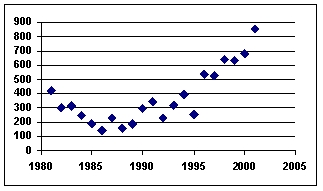
A) linear
B) quadratic
C) cosine
D) tangential
E) flat
Correct Answer:

Verified
Correct Answer:
Verified
Related Questions
Q11: One of the ways to overcome the
Q24: When a trucking firm uses the number
Q51: Using a three-month moving average,the forecast value
Q53: Jim Royo,manager of Billings Building Supply
Q56: Using a three-month moving average,the forecast value
Q61: A stationary time-series data has only trend,
Q81: Two popular general categories of smoothing techniques
Q86: In an autoregressive forecasting model, the independent
Q93: When forecasting with exponential smoothing, data from
Q99: An exponential smoothing technique in which the