Multiple Choice
According to the following graphic,X and Y have _________. 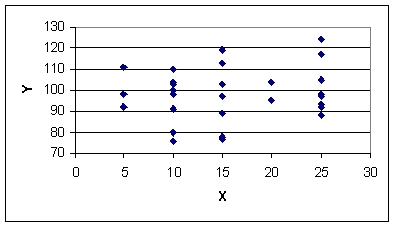
A) strong negative correlation
B) virtually no correlation
C) strong positive correlation
D) moderate negative correlation
E) weak negative correlation
Correct Answer:

Verified
Correct Answer:
Verified
Related Questions
Q17: The strength of a linear relationship in
Q24: From the following scatter plot,we can say
Q26: A simple regression model developed for ten
Q28: Abby Kratz,a market specialist at the market
Q38: In simple regression analysis the error terms
Q59: Regression output from Minitab software directly displays
Q68: The numerical value of the coefficient of
Q78: A manager wants to predict the cost
Q80: Regression output from Minitab software includes an
Q82: Given x, a 95% prediction interval for