Multiple Choice
The following residuals plot indicates _______________. 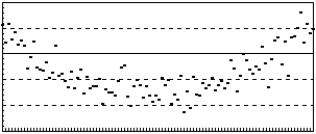
A) a nonlinear relation
B) a nonconstant error variance
C) the simple regression assumptions are met
D) the sample is biased
E) a random sample
Correct Answer:

Verified
Correct Answer:
Verified
Related Questions
Q4: If the correlation coefficient between two variables
Q7: The F-value to test the overall significance
Q16: A researcher has developed a regression
Q29: The equation of the trend line for
Q37: If there is positive correlation between two
Q39: If there is perfect negative correlation between
Q39: From the following scatter plot,we can say
Q47: Abby Kratz,a market specialist at the market
Q51: In the simple regression model,y = 21
Q68: A manager wants to predict the cost