Multiple Choice
The United Nations Development Programme website provides comparative data by country on key metrics.Two such metrics are life expectancy and expenditures on health as a percent of
GDP.The table below show data on life expectancy and health expenditures in the United States. Which of the following scatterplots best depicts the relationship between life expectancy and
Expenditures on health as a percent of GDP?
A) 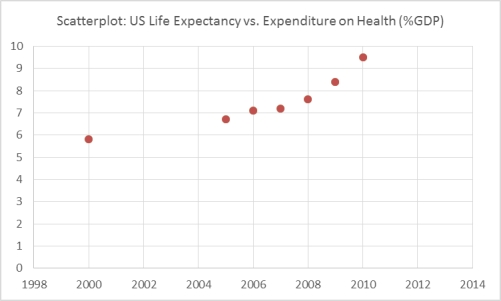
B) 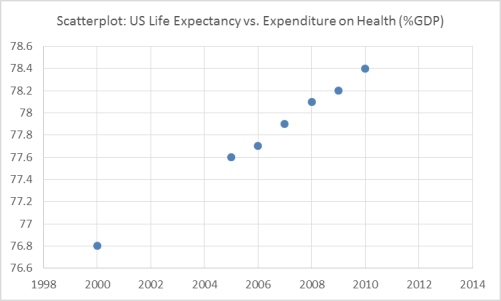
C) 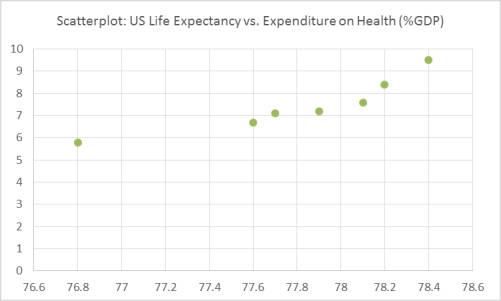
D) 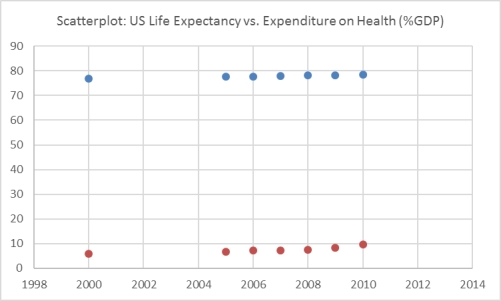
Correct Answer:

Verified
Correct Answer:
Verified
Q4: The staff of Mr.Wayne Wertz,VP of Operations
Q5: Each day,the office staff at Oasis Quick
Q6: According to the following graphic,"Bent Pins" account
Q8: Suppose a market survey of 200 consumers
Q10: An instructor has decided to graphically represent
Q12: Each day,the office staff at Oasis Quick
Q13: According to the following graphic,the most common
Q40: A Pareto chart and a pie chart
Q56: If the individual class frequency is divided
Q82: For a company in gardening supplies business,the