Short Answer
Draw the frequency polygon for the following distribution (there are 30 scores in the distribution).In addition,calculate the mean,median,and mode for the distribution.
48,50,53,59,59,63,63,67,67,67,72,72,72,78,78,78,78,85,85,85,85,85,90,90,90,90,95,95,98,100 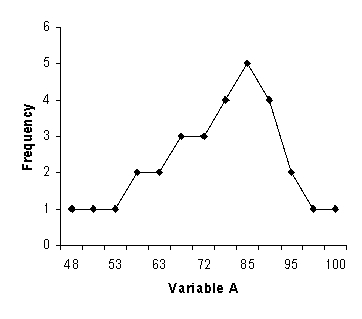
Correct Answer:

Verified
Mean = 76....View Answer
Unlock this answer now
Get Access to more Verified Answers free of charge
Correct Answer:
Verified
View Answer
Unlock this answer now
Get Access to more Verified Answers free of charge
Q2: If Joe scored 25 on a test
Q3: A z-score is most affected by the<br>A)median.<br>B)mode.<br>C)standard
Q4: Imagine that 86,999 people who are penniless
Q5: A variable for which the scores represent
Q6: Bar graphs are to _ as frequency
Q8: A graphical representation of a frequency distribution
Q9: A categorical variable for which each value
Q10: The calculation of the average deviation differs
Q11: A number that characterizes the "middleness" of
Q12: Faculty in the psychology department at State