Multiple Choice
The following histogram represents the distribution of acceptance rates (percent accepted) among 25 business schools in 2004. In each class interval, the left endpoint but not the right is included, so the class intervals are 10 rate < 15, 15 rate < 20, etc. 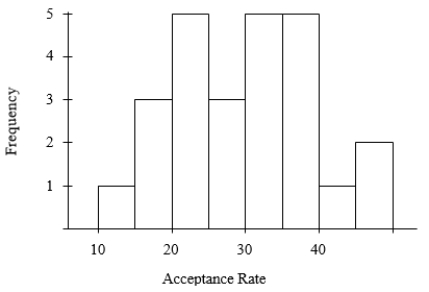 Which of the following could be the five-number summary for these data?
A) 10, 22, 31, 39, 50
B) 10, 20, 30, 40, 50
C) 10, 26, 31, 34, 50
D) 10, 22, 31, 29, 39
Correct Answer:

Verified
Correct Answer:
Verified
Q21: For each of the states and Puerto
Q22: A teacher returns an exam with possible
Q23: Enteroliths are calcifications that form in the
Q24: The exam scores (out of 100 points)
Q25: A violin student records the number of
Q27: The following histogram represents the distribution of
Q28: A survey of 10 students was conducted
Q29: The median age of five people in
Q30: The exam scores (out of 100 points)
Q31: The following is a sample of the