Multiple Choice
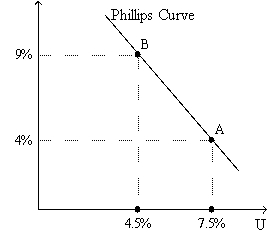
Figure 17-3. The left-hand graph shows a short-run aggregate-supply (SRAS) curve and two aggregate-demand (AD) curves. On the left-hand diagram, Y represents output and on the right-hand diagram, U represents the unemployment rate.
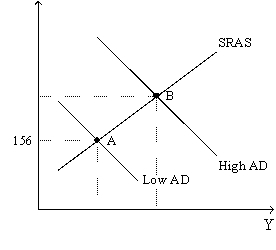
-Refer to Figure 17-3. What is measured along the vertical axis of the left-hand graph?
A) the wage rate
B) the inflation rate
C) the price level
D) the change in output from one year to the next
Correct Answer:

Verified
Correct Answer:
Verified
Q30: The short-run Phillips curve indicates that expansionary
Q33: Which of the following is correct if
Q62: For many years country A has had
Q74: Proponents of rational expectations argue that failing
Q75: Disinflation would eventually cause<br>A)the short-run and the
Q127: Friedman argued that the Fed could use
Q131: An adverse supply shock will shift short-run
Q150: A policy change that reduces the natural
Q190: Contractionary monetary policy<br>A)leads to disinflation and makes
Q198: Some countries have had relatively high inflation