Multiple Choice
Figure 17-3. The left-hand graph shows a short-run aggregate-supply (SRAS) curve and two aggregate-demand (AD) curves. On the left-hand diagram, Y represents output and on the right-hand diagram, U represents the unemployment rate.
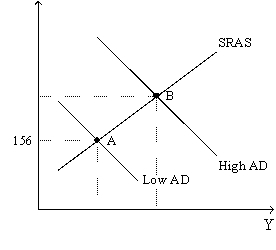
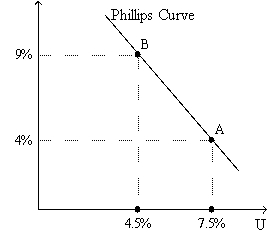
-Refer to Figure 17-3. What is measured along the vertical axis of the right-hand graph?
A) the interest rate
B) the inflation rate
C) the government's budget deficit as a percent of GDP
D) the growth rate of the nominal money supply
Correct Answer:

Verified
Correct Answer:
Verified
Q28: If a central bank wants to counter
Q48: In 1968,economist Milton Friedman published a paper
Q55: Suppose a central bank announced that it
Q61: In the long run,which of the following
Q68: According to classical macroeconomic theory,in the long
Q129: According to Friedman and Phelps,the unemployment rate
Q133: Figure 17-7<br>Use this graph to answer the
Q137: Figure 17-2<br>Use the pair of diagrams below
Q140: Figure 17-1. The left-hand graph shows a
Q183: What did Friedman and Phelps predict would