Multiple Choice
Figure 17-5
Use the graph below to answer the following questions.
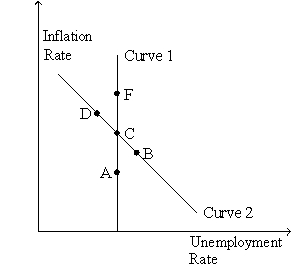
-Refer to Figure 17-5. Curve 1 is the
A) long-run aggregate supply curve.
B) short-run aggregate supply curve.
C) long-run Phillips curve.
D) short-run Phillips curve.
Correct Answer:

Verified
Correct Answer:
Verified
Q7: In the 1970's the Federal Reserve responded
Q17: Suppose the Federal Reserve pursues contractionary monetary
Q23: When they are confronted with an adverse
Q36: If the short-run Phillips curve were stable,which
Q37: The long-run response to an increase in
Q44: Considering a plot of the inflation rate
Q61: In the long run,which of the following
Q134: According to the Friedman-Phelps analysis, in the
Q137: The sacrifice ratio of the Volcker disinflation
Q140: Figure 17-1. The left-hand graph shows a