Multiple Choice
Figure 17-8. The left-hand graph shows a short-run aggregate-supply (SRAS) curve and two aggregate-demand (AD) curves. On the right-hand diagram, "Inf Rate" means "Inflation Rate."

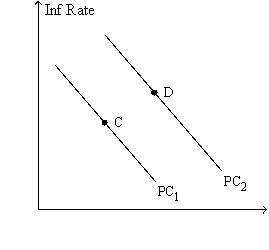
-Refer to Figure 17-8. What is measured along the horizontal axis of the right-hand graph?
A) time
B) the unemployment rate
C) real GDP
D) the growth rate of real GDP
Correct Answer:

Verified
Correct Answer:
Verified
Q39: Which of the following shifts the long-run
Q47: In 1980,the combination of inflation and unemployment
Q50: The Phillips curve and the short-run aggregate
Q58: If the economy is at the point
Q63: An adverse supply shock shifts the short-run
Q69: Figure 17-8. The left-hand graph shows a
Q72: In the long run,a decrease in the
Q72: Figure 17-2<br>Use the pair of diagrams below
Q179: If unemployment is above its natural rate,
Q231: Country A's long-run Phillips curve is farther