Multiple Choice
Figure 17-8. The left-hand graph shows a short-run aggregate-supply (SRAS) curve and two aggregate-demand (AD) curves. On the right-hand diagram, "Inf Rate" means "Inflation Rate."

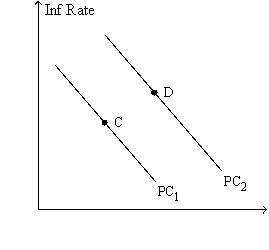
-Refer to Figure 17-8. The shift of the aggregate-supply curve from AS1 to AS2
A) results in a more favorable trade-off between inflation and unemployment.
B) results in a more favorable trade-off between inflation and the growth rate of real GDP.
C) represents an adverse shock to aggregate supply.
D) represents a favorable shock to aggregate supply.
Correct Answer:

Verified
Correct Answer:
Verified
Q26: If unemployment is below its natural rate,what
Q36: Which of the following would cause the
Q41: Which of the following is an example
Q44: The short-run relationship between inflation and unemployment
Q79: Figure 17-6<br>Use the two graphs in the
Q80: Figure 17-7<br>Use this graph to answer the
Q80: Phillips found a<br>A)positive relation between unemployment and
Q131: If the government reduced the minimum wage
Q135: If the Federal Reserve increases the growth
Q221: In the early 1970s, the short-run Phillips