Multiple Choice
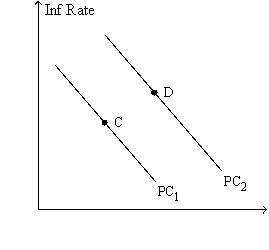
Figure 17-8. The left-hand graph shows a short-run aggregate-supply (SRAS) curve and two aggregate-demand (AD) curves. On the right-hand diagram, "Inf Rate" means "Inflation Rate."

-Refer to Figure 17-8. Which of the following events could explain the shift of the aggregate-supply curve from AS1 to AS2?
A) a reduction in firms' costs of production
B) a reduction in taxes on consumers
C) an increase in the price level
D) an increase in the world price of oil
Correct Answer:

Verified
Correct Answer:
Verified
Q4: Which of the following is correct if
Q17: Suppose the Federal Reserve pursues contractionary monetary
Q20: Which of the following describes the Volcker
Q36: If the short-run Phillips curve were stable,which
Q37: The long-run response to an increase in
Q45: In most of the 1970s, the Fed's
Q66: From 2008-2009 the Federal Reserve created a
Q134: According to the Friedman-Phelps analysis, in the
Q137: The sacrifice ratio of the Volcker disinflation
Q152: The analysis of Friedman and Phelps argues