Multiple Choice
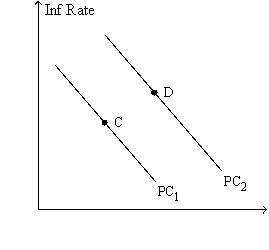
Figure 17-8. The left-hand graph shows a short-run aggregate-supply (SRAS) curve and two aggregate-demand (AD) curves. On the right-hand diagram, "Inf Rate" means "Inflation Rate."

-Refer to Figure 17-8. The shift of the aggregate-supply curve from AS1 to AS2 could be a consequence of
A) an increase in the money supply.
B) an adverse supply shock.
C) a decrease of output from Y1 to Y2.
D) a slow adjustment of people's expectation of the inflation rate.
Correct Answer:

Verified
Correct Answer:
Verified
Q11: In the long run,inflation<br>A)and unemployment are primarily
Q50: Samuelson and Solow reasoned that when aggregate
Q74: Proponents of rational expectations argue that failing
Q81: According to Friedman and Phelps,policymakers face a
Q127: Friedman argued that the Fed could use
Q131: An adverse supply shock will shift short-run
Q181: Figure 17-6<br>Use the two graphs in the
Q198: Some countries have had relatively high inflation
Q204: How would a decrease in the natural
Q239: From 1993-2001 the U.S. economy experienced<br>A)relatively low