Multiple Choice
Figure 17-8. The left-hand graph shows a short-run aggregate-supply (SRAS) curve and two aggregate-demand (AD) curves. On the right-hand diagram, "Inf Rate" means "Inflation Rate."

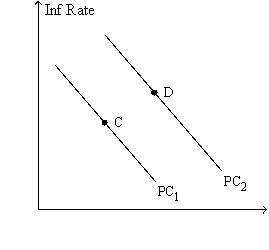
-Refer to Figure 17-8. A movement of the economy from point A to point B, and at the same time a movement from point C to point D, would be described as
A) the outcome of a favorable supply shock.
B) falling inflation.
C) stagflation.
D) All of the above are correct.
Correct Answer:

Verified
Correct Answer:
Verified
Q14: A rightward shift of the short-run aggregate-supply
Q26: Phillips found a negative relation between<br>A)output and
Q26: Other things the same,if the central bank
Q46: The monetary-policy framework called inflation targeting is
Q68: Other things the same, an increase in
Q92: Figure 17-1. The left-hand graph shows a
Q105: In the long run,an increase in the
Q141: In the long run,if there is an
Q193: According to the Phillips curve, unemployment and
Q215: Sticky wages leads to a positive relationship