Multiple Choice
Figure 16-3.
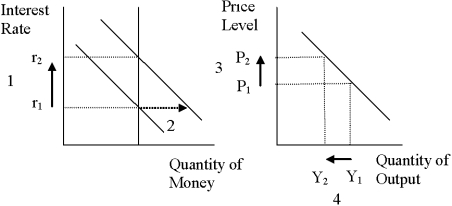
-Refer to Figure 16-3. What quantity is represented by the vertical line on the left-hand graph?
A) the supply of money
B) the demand for money
C) the rate of inflation
D) the quantity of bonds that was most recently sold or purchased by the Federal Reserve
Correct Answer:

Verified
Correct Answer:
Verified
Q26: Paul Samuelson, a famous economist, said that<br>A)"the
Q26: According to John Maynard Keynes,<br>A)the demand for
Q28: A 2009 article in The Economist noted
Q40: The interest rate falls if<br>A)the price level
Q60: Liquidity preference theory is most relevant to
Q84: When the government reduces taxes,which of the
Q96: An essential piece of the liquidity preference
Q204: If the marginal propensity to consume is
Q271: An increase in government purchases is likely
Q288: Figure 16-6. On the left-hand graph, MS