Multiple Choice
Figure 16-4. On the figure, MS represents money supply and MD represents money demand.
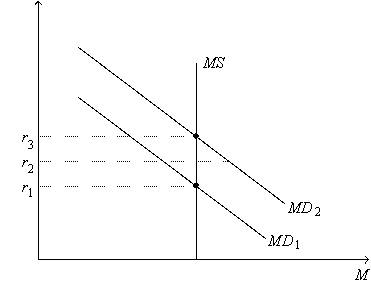
-Refer to Figure 16-4. Which of the following events could explain a decrease in the equilibrium interest rate from r3 to r1?
A) a decrease in the price level
B) a decrease in the number of firms building new factories and buying new equipment
C) an increase in the price level
D) an increase in the number of firms building new factories and buying new equipment
Correct Answer:

Verified
Correct Answer:
Verified
Q13: A decrease in government spending initially and
Q18: If businesses and consumers become pessimistic,the Federal
Q31: Initially, the economy is in long-run equilibrium.
Q66: Which of the following shifts aggregate demand
Q74: Liquidity refers to<br>A)the relation between the price
Q100: The interest rate would fall and the
Q109: Changes in monetary policy aimed at reducing
Q196: An increase in the money supply decreases
Q204: Suppose that the government increases expenditures by
Q339: Figure 16-3.<br> <img src="https://d2lvgg3v3hfg70.cloudfront.net/TB4797/.jpg" alt="Figure 16-3.