Multiple Choice
Figure 16-5. On the figure, MS represents money supply and MD represents money demand.
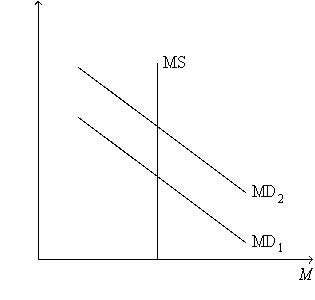
-Refer to Figure 16-5. What is measured along the vertical axis of the graph?
A) the quantity of output
B) the amount of crowding out
C) the interest rate
D) the price level
Correct Answer:

Verified
Correct Answer:
Verified
Q31: A significant example of a temporary tax
Q45: Government purchases are said to have a<br>A)multiplier
Q62: Critics of stabilization policy argue that<br>A)there is
Q81: There are three factors that help explain
Q81: According to the theory of liquidity preference,if
Q102: The Federal Funds rate is the interest
Q131: If the Fed conducts open-market purchases,then which
Q141: Scenario 16-1. Take the following information as
Q178: If the interest rate increases<br>A)or if the
Q223: Other things the same, which of the