Multiple Choice
Figure 16-5. On the figure, MS represents money supply and MD represents money demand.
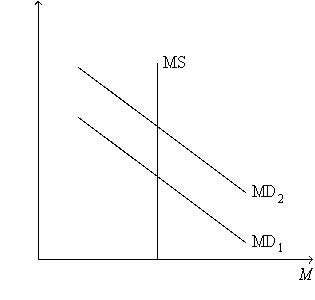
-Refer to Figure 16-5. A shift of the money-demand curve from MD1 to MD2 could be a result of
A) a decrease in taxes.
B) an increase in government spending.
C) an increase in the price level.
D) All of the above are correct.
Correct Answer:

Verified
Correct Answer:
Verified
Q7: The multiplier is computed as MPC /
Q8: An increase in the money supply decreases
Q45: The primary argument against active monetary and
Q52: An increase in government spending initially and
Q52: What is the difference between monetary policy
Q75: Supply-side economists believe that changes in government
Q87: The multiplier effect<br>A)and the crowding-out effect both
Q104: In 2009 President Obama and Congress increased
Q132: According to liquidity preference theory,a decrease in
Q160: Which of the following sequences best