Multiple Choice
Figure 9-4. The figure shows a utility function for Dexter.
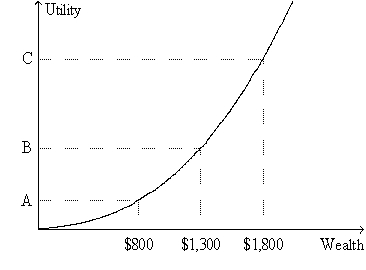
-Refer to Figure 9-4. In what way(s) does the graph differ from the usual case?
A) The utility function shown here is upward-sloping, whereas in the usual case the utility function is downward-sloping.
B) The utility function shown here is bowed downward (convex) , whereas in the usual case the utility function is bowed upward (concave) .
C) On the graph shown here, wealth is measured along the horizontal axis, whereas in the usual case saving is measured along the horizontal axis.
D) On the graph shown here, utility is measured along the vertical axis, whereas in the usual case satisfaction is measured along the vertical axis.
Correct Answer:

Verified
Correct Answer:
Verified
Q18: Figure 9-5. On the graph, x represents
Q35: If you are convinced that stock prices
Q37: The possibility of speculative bubbles in the
Q58: In general,as a person includes fewer stocks
Q66: Diversification<br>A)increases the likely fluctuation in a portfolio's
Q69: The risk of a portfolio<br>A)increases as the
Q115: Four years ago Ollie deposited some money
Q123: Managed mutual funds usually outperform mutual funds
Q179: A company that produces computer peripherals is
Q187: What is the present value of a