Multiple Choice
Use the following to answer the question below.
The time series graph below shows monthly sales figures for a specialty gift item sold on the Home Shopping Network (HSN) . 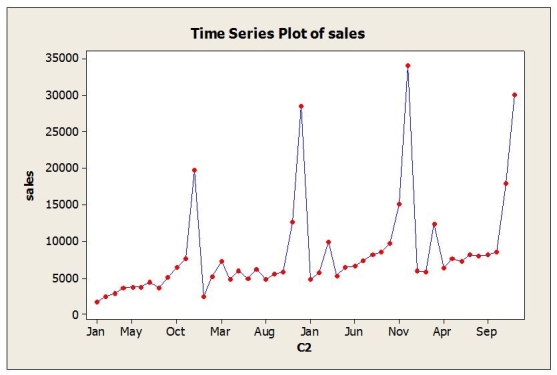
-The dominant time series component in these data is
A) Cyclical
B) Seasonal
C) Randomness
D) Irregular
E) Error
Correct Answer:

Verified
Correct Answer:
Verified
Q9: Machine oil is used by clothing manufacturers
Q15: Use the following to answer the question(s)
Q16: Use the following to answer the question(s)
Q18: The standard deviations (in thousands of dollars)
Q19: An automatic filling process is used to
Q20: Use the following to answer the question(s)
Q20: A producer of specialty products uses a
Q21: Use the following to answer the question(s)
Q24: Use the following to answer the question(s)
Q25: Use the following to answer the question(s)