Multiple Choice
Use the following to answer the question(s) below.
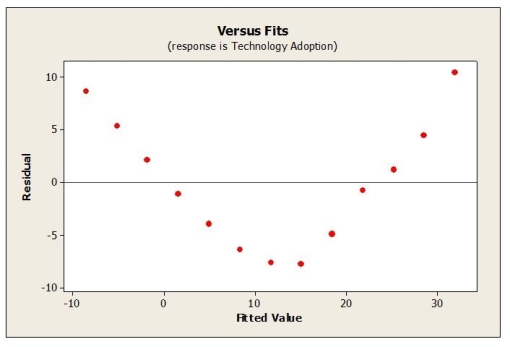
A linear regression model was fit to data representing technology adoption over time. The regression output and residual plot appears below. 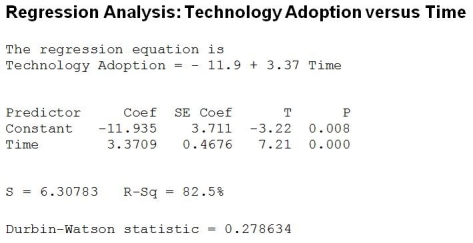
-Which of the following is true?
A) The linear model explains 82.5 % of the variability in technology adoption.
B) The linear model is appropriate.
C) The linear model is not appropriate.
D) The linear model explains 82.5 % of the variability in technology adoption and the linear model is appropriate.
E) The linear model explains 82.5 % of the variability in technology adoption and the linear model is not appropriate.
Correct Answer:

Verified
Correct Answer:
Verified
Q2: Using the estimated regression equation to predict
Q3: Use the following to answer the questions
Q4: At α = 0.05 we can conclude
Q5: Use the following to answer the question(s)
Q6: Use the following to answer the question(s)
Q8: Which statement about residuals plot is true?<br>I.
Q9: Below is the plot of residuals versus
Q10: Use the following to answer the question(s)
Q11: Which statement about re-expressing data is true?<br>I.
Q12: Which of the following is the correct