Multiple Choice
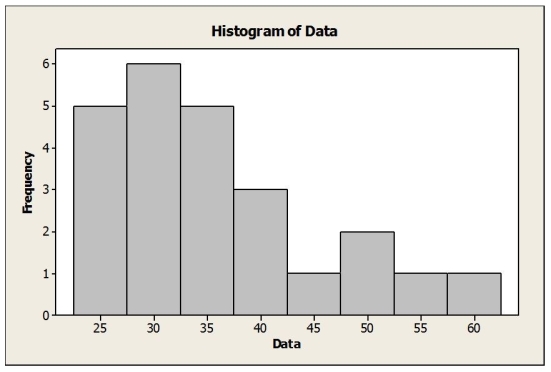
Which is true for the data shown in the histogram?  I. The distribution is skewed to the right.
II. The mean is probably smaller than the median.
III. It is appropriate to summarize these data with the mean and standard deviation.
A) I only
B) II only
C) I and II
D) I and III
E) I, II and III
Correct Answer:

Verified
Correct Answer:
Verified
Q7: Use the following to answer the question(s)
Q9: Use the following to answer the question(s)
Q13: Statscan publishes the monthly CPI (consumer price
Q14: Use the following to answer the question(s)
Q15: Use the following to answer the question(s)
Q17: Use the following to answer the question(s)
Q19: What type of variable is the style
Q23: Use the following to answer the question(s)
Q28: Use the following to answer the question(s)
Q31: Use the following to answer the question(s)