Multiple Choice
Below is the plot of residuals versus predicted values for this estimated multiple regression model. What does the residual plot suggest? 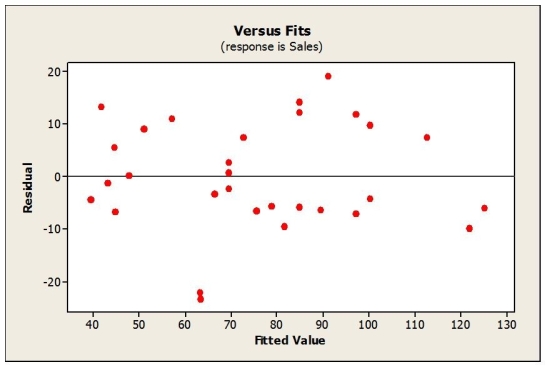
A) The Linearity condition is not satisfied.
B) There is an extreme departure from normality.
C) The variance is not constant.
D) The presence of a couple of outliers.
E) The plot thickens from left to right.
Correct Answer:

Verified
Correct Answer:
Verified
Q2: Consider the following to answer the question(s)
Q7: Consider the following to answer the question(s)
Q10: Consider the following to answer the question(s)
Q11: At α = 0.01, we can conclude
Q12: Consider the following to answer the question(s)
Q13: Consider the following to answer the question(s)
Q14: Based on the estimated multiple regression model,
Q17: Consider the following to answer the question(s)
Q18: If an additional explanatory variable was added
Q20: Consider the following to answer the question(s)