Essay
For the scatterplots shown below, indicate what about the data make nonparametric
methods appropriate for measuring the association between x and y.
a. 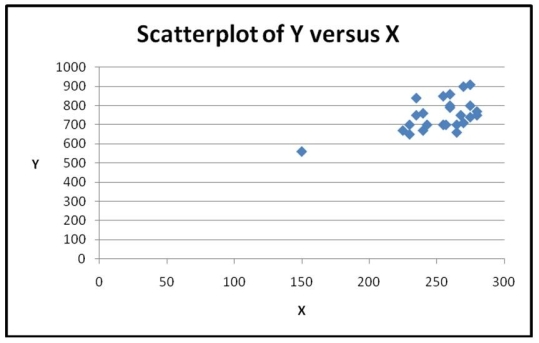 b.
b. 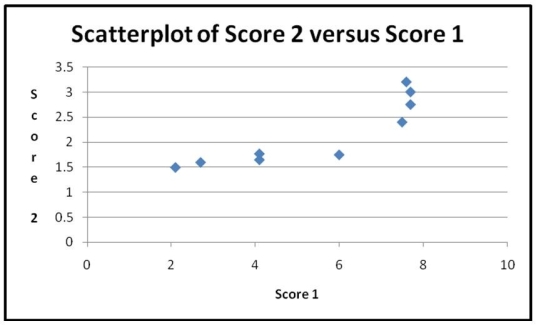
Correct Answer:

Verified
a. Outlier condition...View Answer
Unlock this answer now
Get Access to more Verified Answers free of charge
Correct Answer:
Verified
View Answer
Unlock this answer now
Get Access to more Verified Answers free of charge
Q2: The best tasting ice creams are generally
Q4: A management professor was teaching a course
Q6: The Wilcoxon signed-rank test is used to
Q7: Suppose the Wilcoxon signed-rank test was used
Q8: Consider the following to answer the question(s)
Q10: Consumers were asked to "rate" the taste
Q11: Suppose the Wilcoxon signed-rank test was used
Q12: Consider the following to answer the question(s)
Q20: A particular additive is claimed to increase
Q23: Consider the following to answer the question(s)