Essay
The following scatterplot shows monthly sales figures (in units) and number of months of experience on the job for a sample of 18 salespeople. 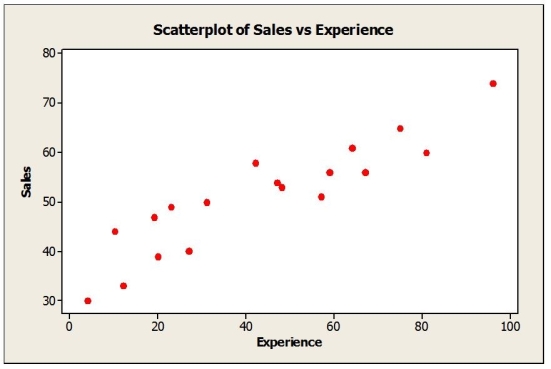 a. Describe the association between monthly sales and level of experience.
b. Do these data satisfy the conditions for computing a correlation coefficient? Explain.
c. Estimate the correlation.
Correct Answer:

Verified
a. Direction: positive; form: straight; ...View Answer
Unlock this answer now
Get Access to more Verified Answers free of charge
Correct Answer:
Verified
View Answer
Unlock this answer now
Get Access to more Verified Answers free of charge
Q3: Shown below is a correlation table showing
Q4: Consider the following sample data. The standard
Q5: Which of the following statements is correct?<br>A)
Q6: Consider the following to answer the question(s)
Q8: The following scatterplot shows a relationship between
Q9: Based on the scatterplots shown below, describe
Q10: In discussing how its customers use online
Q11: In a university statistics course a correlation
Q12: Assume that a medical research study found
Q22: Consider the following to answer the question(s)