Essay
A consumer research group investigating the relationship between the price of meat (per kilogram) and the fat content (grams) gathered data that produced the following scatterplot. 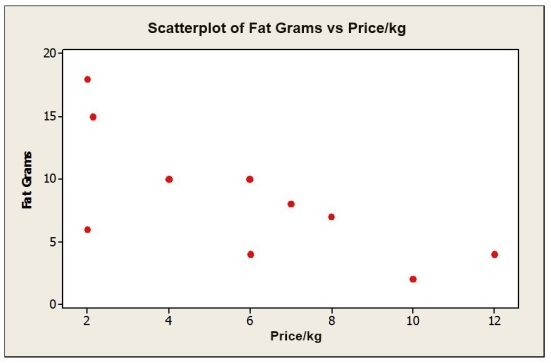 a. Describe the association between the price of meat and fat content.
b. Estimate the correlation.
c. If the point in the lower left hand corner ($2.00 per kilogram, 6 grams of fat) is removed, would the correlation become stronger, weaker, or remain the same? Explain.
Correct Answer:

Verified
a. Direction: negative; form: moderate s...View Answer
Unlock this answer now
Get Access to more Verified Answers free of charge
Correct Answer:
Verified
View Answer
Unlock this answer now
Get Access to more Verified Answers free of charge
Q10: In discussing how its customers use online
Q10: Consider the following to answer the question(s)
Q11: In a university statistics course a correlation
Q12: Assume that a medical research study found
Q14: A study examined consumption levels of oil
Q16: A supermarket chain gathers data on the
Q18: Shown below is a correlation table showing
Q19: The University recently sampled five full time
Q20: Shown below is a correlation table showing
Q25: Consider the following to answer the question(s)