Multiple Choice
Below is a time series graph for monthly closing stock prices of 3M Dental Products. Which of the following statements is true? 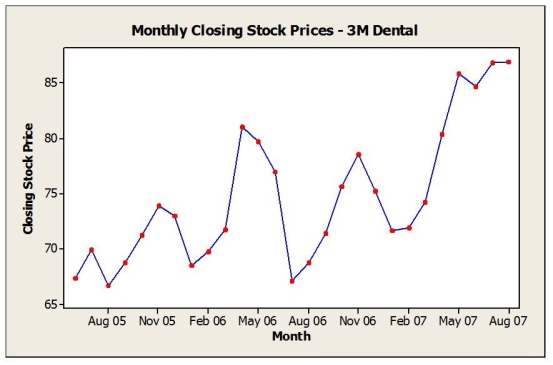
A) The data are stationary.
B) The data show an upward trend.
C) A histogram would provide a good representation of these data.
D) The data show a downward trend.
E) A boxplot would provide a good representation of this data.
Correct Answer:

Verified
Correct Answer:
Verified
Q8: Below is the five-number summary of salaries
Q9: The asking price for homes on the
Q10: Below is the five-number summary of salaries
Q11: Below is the five number summary of
Q12: Consider the following to answer the question(s)
Q14: The table below shows closing share prices
Q15: Consider the following to answer the question(s)
Q16: Consider the following to answer the question(s)
Q17: The table below shows data on total
Q18: Which of the following best describes the