Multiple Choice
The following bar chart for these data shows 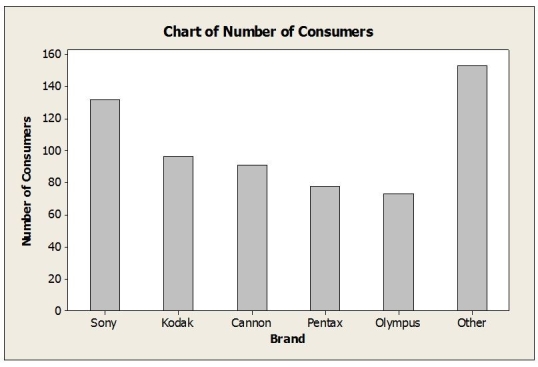
A) the marginal distribution of brands
B) the conditional distribution of brands
C) the marginal distribution of gender
D) the conditional distribution of gender
E) the joint distribution of brands
Correct Answer:

Verified
Correct Answer:
Verified
Q1: Consider the following to answer the question(s)
Q3: Consider the following to answer the question(s)
Q9: Here is the side-by-side bar chart for
Q11: A study was recently done in which
Q12: Consider the following to answer the question(s)
Q13: Consider the following to answer the question(s)
Q15: Consider the following to answer the question(s)
Q20: Consider the following to answer the question(s)
Q22: Consider the following to answer the question(s)
Q31: Consider the following to answer the question(s)