Multiple Choice
Figure 27-5.The figure shows a utility function for Dexter. 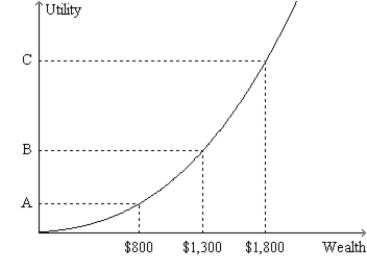
-Refer to Figure 27-5.From the appearance of the graph,we know that
A) Dexter's level of satisfaction increases by more when his wealth increases from $1,001 to $1,002 than it does when his wealth increases from $1,000 to $1,001.
B) Dexter's level of satisfaction increases by less when his wealth increases from $1,001 to $1,002 than it does when his wealth increases from $1,000 to $1,001.
C) Dexter's level of satisfaction increases by the same amount when his wealth increases from $1,001 to $1,002 as it does when his wealth increases from $1,000 to $1,001.
D) None of the above answers can be inferred from the appearance of the utility function.
Correct Answer:

Verified
Correct Answer:
Verified
Q98: Figure 27-6.On the graph,x represents risk and
Q99: Figure 27-4.The figure shows a utility function
Q100: Susan is planning to invest in one
Q101: Figure 27-5.The figure shows a utility function
Q102: Risk<br>A)can be reduced by placing a large
Q104: Which of the following games might a
Q105: Kurt decided to increase the number of
Q106: If Cara's utility falls more by losing
Q107: Diversification reduces<br>A)only market risk.<br>B)only firm-specific risk.<br>C)neither market
Q108: John has been a sky diver for