Essay
Figure 33-12. 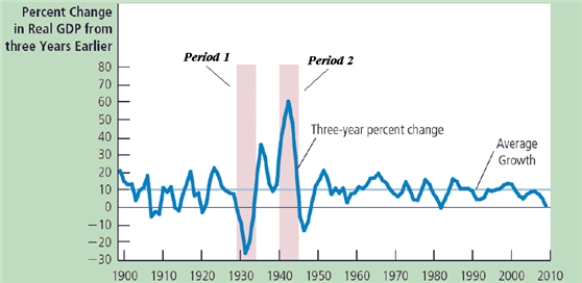
-Refer to Figure 33-12.Explain how the aggregate demand and aggregate supply model changed during periods 1 and 2.
Correct Answer:

Verified
Correct Answer:
Verified
Related Questions
Q4: Figure 33-13. <img src="https://d2lvgg3v3hfg70.cloudfront.net/TB2297/.jpg" alt="Figure 33-13.
Q5: Figure 33-16. <img src="https://d2lvgg3v3hfg70.cloudfront.net/TB2297/.jpg" alt="Figure 33-16.
Q21: Misperceptions theory helps explain what feature of
Q55: Other things the same, what happens in
Q80: Explain how a recession differs from a
Q104: Other things the same, what happens in
Q127: What variables besides real GDP tend to
Q141: Suppose the expected price level increases. Which
Q152: During periods of stagflation, what happens to
Q158: The exchange-rate effect helps explain what feature