Multiple Choice
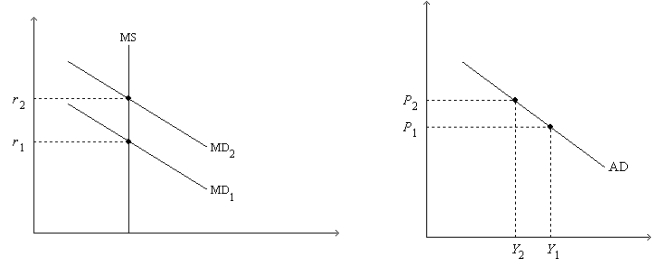
Figure 34-2. On the left-hand graph, MS represents the supply of money and MD represents the demand for money; on the right-hand graph, AD represents aggregate demand. The usual quantities are measured along the axes of both graphs.

-Refer to Figure 34-2. A decrease in Y from Y1 to Y2 is explained as follows:
A) The Federal Reserve increases the money supply, causing the money-demand curve to shift from MD1 to MD2; this shift of MD causes r to increase from r1 to r2; and this increase in r causes Y to decrease from Y1 to Y2.
B) An increase in P from P1 to P2 causes the money-demand curve to shift from MD1 to MD2; this shift of MD causes r to increase from r1 to r2; and this increase in r causes Y to decrease from Y1 to Y2.
C) A decrease in P from P2 to P1 causes the money-demand curve to shift from MD1 to MD2; this shift of MD causes r to increase from r1 to r2; and this increase in r causes Y to decrease from Y1 to Y2.
D) An increase in the price level causes the money-demand curve to shift from MD2 to MD1; this shift of MD causes r to decrease from r2 to r1; and this decrease in r causes Y to decrease from Y1 to Y2.
Correct Answer:

Verified
Correct Answer:
Verified
Q3: Figure 34-11 <img src="https://d2lvgg3v3hfg70.cloudfront.net/TB2297/.jpg" alt="Figure 34-11
Q6: Macroeconomic forecasts are<br>A)precise;this makes policy lags less
Q14: Keynes used the term "animal spirits" to
Q15: Most recessions and depressions<br>A)are accurately forecasted.<br>B)usually occur
Q73: An increase in the MPC<br>A)increases the multiplier,so
Q97: The government buys new weapons systems.The manufacturers
Q105: Scenario 34-1. Take the following information as
Q137: If the Federal Reserve decreases the money
Q187: Monetary policy<br>A)must be described in terms of
Q197: To stabilize output, the Federal Reserve will