Multiple Choice
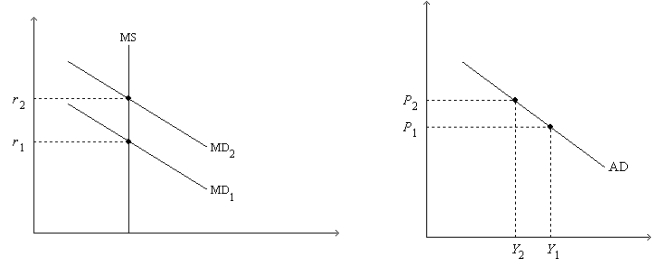
Figure 34-2. On the left-hand graph, MS represents the supply of money and MD represents the demand for money; on the right-hand graph, AD represents aggregate demand. The usual quantities are measured along the axes of both graphs.

-Refer to Figure 34-2. As we move from one point to another along the money-demand curve MD1,
A) the price level is held fixed at P1.
B) the interest rate is held fixed at r1.
C) the money supply is changing so as to keep the money market in equilibrium.
D) the expected inflation rate is changing so as to keep the real interest rate constant.
Correct Answer:

Verified
Correct Answer:
Verified
Q36: When the Fed lowers the growth rate
Q40: The interest rate falls if<br>A)the price level
Q59: A 2009 article in The Economist noted
Q62: Changes in the interest rate<br>A)shift aggregate demand
Q71: Suppose there is an increase in government
Q73: Automatic stabilizers<br>A)increase the problems that lags cause
Q78: Which of the following statements is correct
Q112: A tax increase has<br>A)a multiplier effect but
Q153: If the Federal Reserve's goal is to
Q196: An increase in the money supply decreases