Multiple Choice
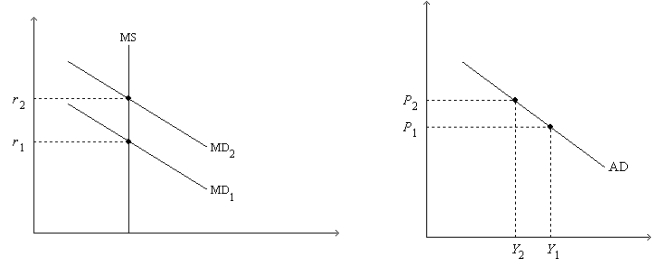
Figure 34-2. On the left-hand graph, MS represents the supply of money and MD represents the demand for money; on the right-hand graph, AD represents aggregate demand. The usual quantities are measured along the axes of both graphs.

-Refer to Figure 34-2. Assume the money market is always in equilibrium. Under the assumptions of the model,
A) the quantity of goods and services demanded is higher at P2 than it is at P1.
B) the quantity of money is higher at Y1 than it is at Y2.
C) an increase in r from r1 to r2 is associated with a decrease in Y from Y1 to Y2.
D) All of the above are correct.
Correct Answer:

Verified
Correct Answer:
Verified
Q8: Figure 34-8 <img src="https://d2lvgg3v3hfg70.cloudfront.net/TB4802/.jpg" alt="Figure 34-8
Q13: A decrease in government spending initially and
Q57: Which of the following sequences best explains
Q60: Liquidity preference theory is most relevant to
Q84: Which of the effects listed below increases
Q87: Figure 34-1 <img src="https://d2lvgg3v3hfg70.cloudfront.net/TB2297/.jpg" alt="Figure 34-1
Q99: In 2009 President Obama and Congress increased
Q146: Critics of stabilization policy argue that<br>A)policy affects
Q147: To offset increased pessimism by households, the
Q191: Policymakers use _ policy and _ policy