Multiple Choice
Figure 34-4. On the figure, MS represents money supply and MD represents money demand. 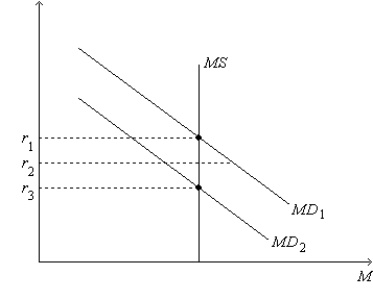
-Refer to Figure 34-4. Which of the following events could explain a shift of the money-demand curve from MD1 to MD2?
A) a decrease in the price level
B) a decrease in the cost of borrowing
C) an increase in the price level
D) an increase in the cost of borrowing
Correct Answer:

Verified
Correct Answer:
Verified
Q49: Suppose stock prices rise.To offset the resulting
Q60: A policy that results in slow and
Q90: Scenario 34-2.The following facts apply to a
Q98: Suppose that the government spends more on
Q110: Which of the following would not be
Q124: Figure 34-2.On the left-hand graph,MS represents the
Q134: Other things the same,which of the following
Q158: Figure 34-2.On the left-hand graph,MS represents the
Q205: Which of the following properly describes the
Q431: In the long run, fiscal policy primarily