Multiple Choice
Figure 34-5.On the figure,MS represents money supply and MD represents money demand. 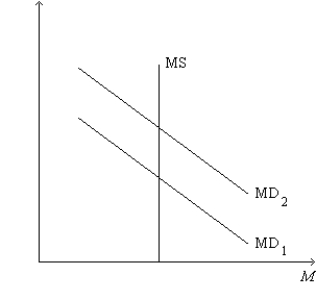
-Refer to Figure 34-5.What is measured along the vertical axis of the graph?
A) the quantity of output
B) the amount of crowding out
C) the interest rate
D) the price level
Correct Answer:

Verified
Correct Answer:
Verified
Related Questions
Q54: Fiscal policy refers to the idea that
Q55: Suppose the MPC is 0.60.Assume there are
Q57: As the MPC gets close to 1,the
Q58: The logic of the multiplier effect applies<br>A)only
Q61: Suppose an economy's marginal propensity to consume
Q63: When there is an increase in government
Q94: A tax cut shifts the aggregate demand
Q104: If the government cuts the tax rate,
Q118: If the MPC = 4/5, then the
Q122: Assume there is a multiplier effect, some