Multiple Choice
Figure 34-5. On the figure, MS represents money supply and MD represents money demand. 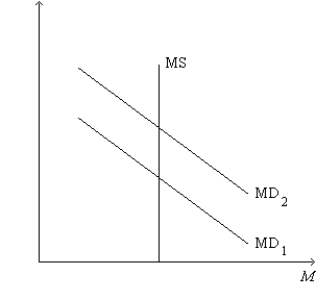
-Refer to Figure 34-5. A shift of the money-demand curve from MD1 to MD2 could be a result of
A) a decrease in taxes.
B) an increase in government spending.
C) an increase in the price level.
D) All of the above are correct.
Correct Answer:

Verified
Correct Answer:
Verified
Q12: In the graph of the money market,the
Q16: According to the theory of liquidity preference,
Q45: Shifts in aggregate demand affect the price
Q59: Figure 34-5.On the figure,MS represents money supply
Q68: Initially,the economy is in long-run equilibrium.The aggregate
Q80: Which of the following is correct?<br>A)A higher
Q103: According to liquidity preference theory, if the
Q112: Which particular interest rate(s)do we attempt to
Q189: The interest-rate effect<br>A)depends on the idea that
Q192: A decrease in the domestic _ causes