Multiple Choice
Figure 34-6. On the left-hand graph, MS represents the supply of money and MD represents the demand for money; on the right-hand graph, AD represents aggregate demand. The usual quantities are measured along the axes of both graphs.
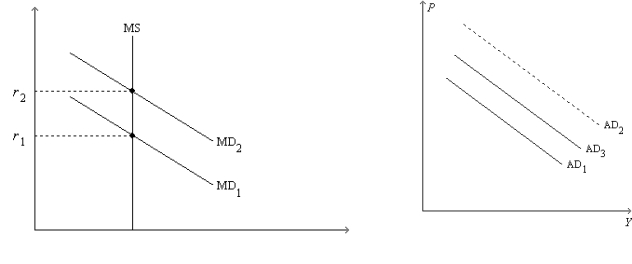
-Refer to Figure 34-6. Suppose the multiplier is 5 and the government increases its purchases by $15 billion. Also, suppose the AD curve would shift from AD1 to AD2 if there were no crowding out; the AD curve actually shifts from AD1 to AD3 with crowding out. Also, suppose the horizontal distance between the curves AD1 and AD3 is $55 billion. The extent of crowding out, for any particular level of the price level, is
A) $75 billion.
B) $40 billion.
C) $30 billion.
D) $20 billion.
Correct Answer:

Verified
Correct Answer:
Verified
Q3: People choose to hold a larger quantity
Q9: People hold money primarily because it<br>A)increases in
Q25: Suppose households attempt to decrease their money
Q29: Explain the logic according to liquidity preference
Q47: Which of the following tends to make
Q81: There are three factors that help explain
Q122: Assume there is a multiplier effect, some
Q123: If the interest rate is above the
Q162: If expected inflation is constant, then when
Q164: A decrease in taxes will shift aggregate