Multiple Choice
Figure 34-6. On the left-hand graph, MS represents the supply of money and MD represents the demand for money; on the right-hand graph, AD represents aggregate demand. The usual quantities are measured along the axes of both graphs.
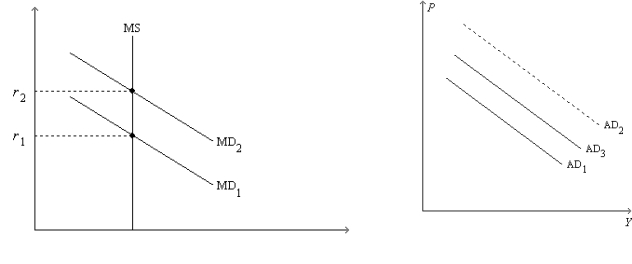
-Refer to Figure 34-6. Suppose the graphs are drawn to show the effects of an increase in government purchases. If it were not for the increase in r from r1 to r2, then
A) there would be no crowding out.
B) the full multiplier effect of the increase in government purchases would be realized.
C) the AD curves that actually apply, before and after the change in government purchases, would be separated horizontally by the distance equal to the multiplier times the change in government purchases.
D) All of the above are correct.
Correct Answer:

Verified
Correct Answer:
Verified
Q18: If expected inflation is constant and the
Q24: During recessions, unemployment insurance payments tend to
Q63: When there is an increase in government
Q63: Some economists argue that<br>A)monetary policy should actively
Q78: Unemployment insurance benefits are an example of
Q89: An increase in the interest rate could
Q119: According to the theory of liquidity preference,if
Q139: If the marginal propensity to consume is
Q176: If the Federal Reserve decided to raise
Q180: If,at some interest rate,the quantity of money