Multiple Choice
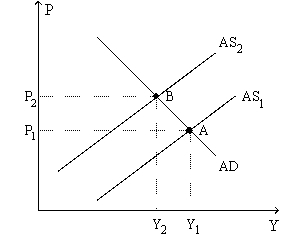
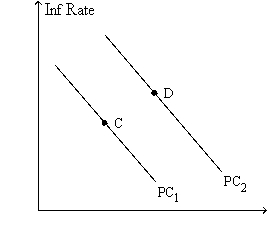
Figure 35-9. The left-hand graph shows a short-run aggregate-supply SRAS) curve and two aggregate-demand AD) curves. On the right-hand diagram, "Inf Rate" means "Inflation Rate." 

-Refer to Figure 35-9. Which of the following events could explain the shift of the aggregate-supply curve from AS1 to AS2?
A) a reduction in firms' costs of production
B) a reduction in taxes on consumers
C) an increase in the price level
D) an increase in the world price of oil
Correct Answer:

Verified
Correct Answer:
Verified
Q20: Which of the following describes the Volcker
Q34: The Economy in 2008<br>In the first half
Q34: Which of the following would not be
Q36: Monetary Policy in Flosserland<br><br>In Flosserland, the Department
Q49: If an increase in inflation permanently reduced
Q61: In the long run,which of the following
Q80: Assume the natural rate of unemployment is
Q81: According to Friedman and Phelps,policymakers face a
Q85: If there is an increase in the
Q176: How are the effects of the financial