Multiple Choice
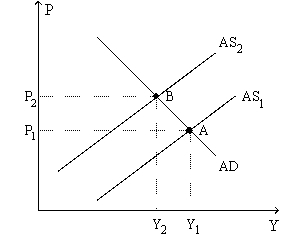
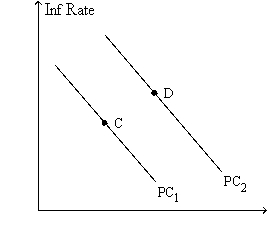
Figure 35-9. The left-hand graph shows a short-run aggregate-supply SRAS) curve and two aggregate-demand AD) curves. On the right-hand diagram, "Inf Rate" means "Inflation Rate." 

-Refer to Figure 35-9. The shift of the aggregate-supply curve from AS1 to AS2 could be a consequence of
A) an increase in the money supply.
B) an adverse supply shock.
C) a decrease of output from Y1 to Y2.
D) a slow adjustment of people's expectation of the inflation rate.
Correct Answer:

Verified
Correct Answer:
Verified
Q9: Country A has a higher money supply
Q21: If the Federal Reserve accommodates an adverse
Q26: If unemployment is below its natural rate,what
Q29: Disinflation is like<br>A)slowing a car down,whereas deflation
Q36: Which of the following would cause the
Q37: The long-run response to an increase in
Q116: Unexpectedly high inflation reduces unemployment in the
Q126: A common explanation for the behavior of
Q135: A central bank announces it will decrease
Q395: Which of the following both make the