Multiple Choice
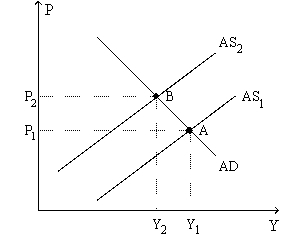
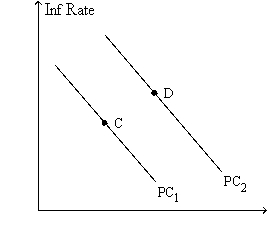
Figure 35-9. The left-hand graph shows a short-run aggregate-supply SRAS) curve and two aggregate-demand AD) curves. On the right-hand diagram, "Inf Rate" means "Inflation Rate." 

-Refer to Figure 35-9. A significant increase in the world price of oil could explain
A) the shift of the aggregate-supply curve from AS1 to AS2, but it could not explain the shift of the Phillips curve from PC1 to PC2.
B) the shift of the Phillips curve from PC1 to PC2, but it could not explain the shift of the aggregate-supply curve from AS1 to AS2.
C) both the shift of the aggregate-supply curve from AS1 to AS2 and the shift of the Phillips curve from PC1 to PC2.
D) neither the shift of the aggregate-supply curve from AS1 to AS2 nor the shift of the Phillips curve from PC1 to PC2.
Correct Answer:

Verified
Correct Answer:
Verified
Q8: An economy has a current inflation rate
Q13: If there is a large and sudden
Q20: Economist A.W.Phillips found a negative correlation between<br>A)output
Q28: The Economy in 2008<br>In the first half
Q36: If the short-run Phillips curve were stable,which
Q37: When aggregate demand shifts left along the
Q71: Although monetary policy cannot reduce the natural
Q99: According to the long-run Phillips curve,in the
Q174: A vertical long-run Phillips curve is consistent
Q196: If the Fed responded to an adverse