Multiple Choice
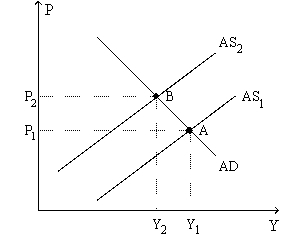
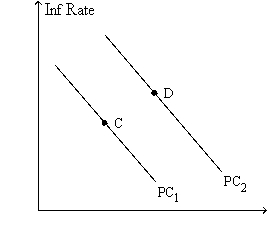
Figure 35-9. The left-hand graph shows a short-run aggregate-supply SRAS) curve and two aggregate-demand AD) curves. On the right-hand diagram, "Inf Rate" means "Inflation Rate." 

-Refer to Figure 35-9. Subsequent to the shift of the Phillips curve from PC1 to PC2, the curve will soon shift back to PC1 if people perceive the
A) increase in the inflation rate as a temporary aberration.
B) economic boom as a temporary aberration.
C) increase in the inflation rate as a sign of a new era of higher inflation.
D) economic boom as a sign of a new era of higher economic growth.
Correct Answer:

Verified
Correct Answer:
Verified
Q2: An adverse supply shock causes output to<br>A)rise.To
Q4: As an economist working for a U.S.government
Q5: An increase in the natural rate of
Q18: Figure 35-5 <img src="https://d2lvgg3v3hfg70.cloudfront.net/TB2297/.jpg" alt="Figure 35-5
Q26: Other things the same,if the central bank
Q32: A favorable supply shock causes output to<br>A)rise.To
Q41: Monetary Policy in Flosserland<br><br>In Flosserland, the Department
Q72: In the long run,a decrease in the
Q84: Other things the same,in the long run
Q92: If asset prices fall and inflation expectations