Multiple Choice
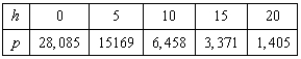
A meteorologist measures the atmospheric pressure P (in kilograms per square meter) at altitude h (in kilometers) . The data are shown below. Use the regression capabilities of the graphing utility to find a linear model for the revised data points obtained by plotting the points 
A) 
B) 
C) 
D) 
E) 
Correct Answer:

Verified
Correct Answer:
Verified
Related Questions
Q12: Sketch a graph of the function <img
Q13: Analyze and sketch a graph of the
Q14: The graph of f is shown below.
Q15: Analyze and sketch a graph of the
Q16: Analyze and sketch a graph of the
Q17: The graph of f is shown below.
Q19: Analyze the graph of the function <img
Q20: The graph of a function f is
Q21: The graph of f is shown below.
Q22: The graph of a function f is