Multiple Choice
In an experiment, students measured the speed s (in meters per second) of a falling object t seconds after it was released. The results are shown in the table below. Use the regression capabilities of a graphing utility to find a linear model for the data. Round all numerical values in your answer to one decimal place. 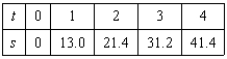
A) 
B) 
C) 
D) 
E) 
Correct Answer:

Verified
Correct Answer:
Verified
Q3: Hooke's Law states that the force F
Q4: A V8 car engine is coupled to
Q5: Each ordered pair gives the exposure index
Q6: Which function below would be most appropriate
Q7: Students in a lab measured the breaking
Q9: A V8 car engine is coupled to
Q10: Students in a lab measured the breaking
Q11: Determine which type of function would be
Q12: In an experiment, students measured the speed
Q13: Hooke's Law states that the force F